There were times when I want to trace instructions from User Mode and continue tracing it into Kernel mode to reverse Windows’s internal implementation with my own supplied parameters from User Mode but there were a big problem and that was, How to access User Mode when you are in a Kernel Debugger or vice versa.
Even if I knew about changing debugger context to specific process but there were other problems which cause reversing kernel in this case, impossible.
Yesterday one of my friends explains me about how to debug it, then we improve this method and now I wanna share my experience on my blog.
Let’s get down to business…
First of all, a Kernel Debugger Windbg is needed in order to continue tracing in Kernel.
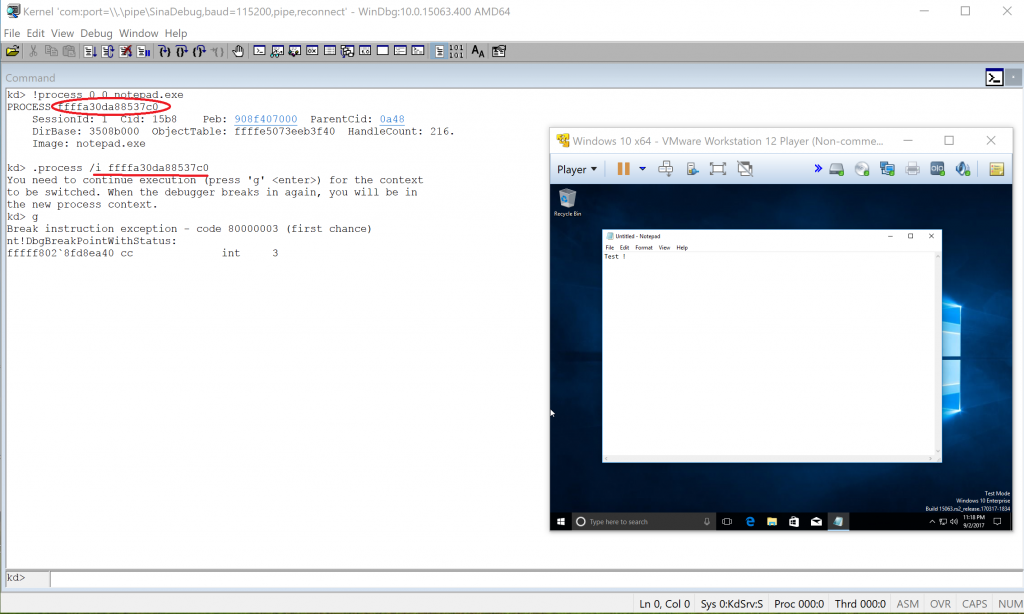
The first essential thing is we need to change the current process context (fs or gs registers) to be able to access user-mode space of the process which we need to trace its functions.
1
!process 0 0 notepad.exe
To get process location then :
1
.process /i AboveAddress
Which will notify you when the processor reaches to this process.
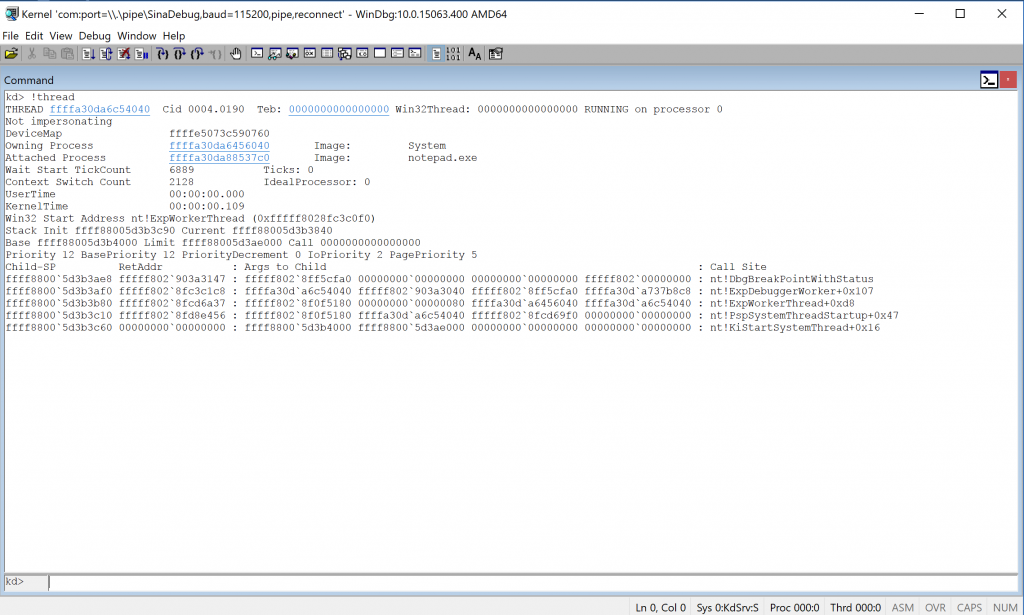
Remember you can also view current process by simply calling !thread as shown below :
Next step is to let windbg continue and it will notify you whenever it reaches to the desired process, so press g.
1
g
It’s getting a little tricky here.
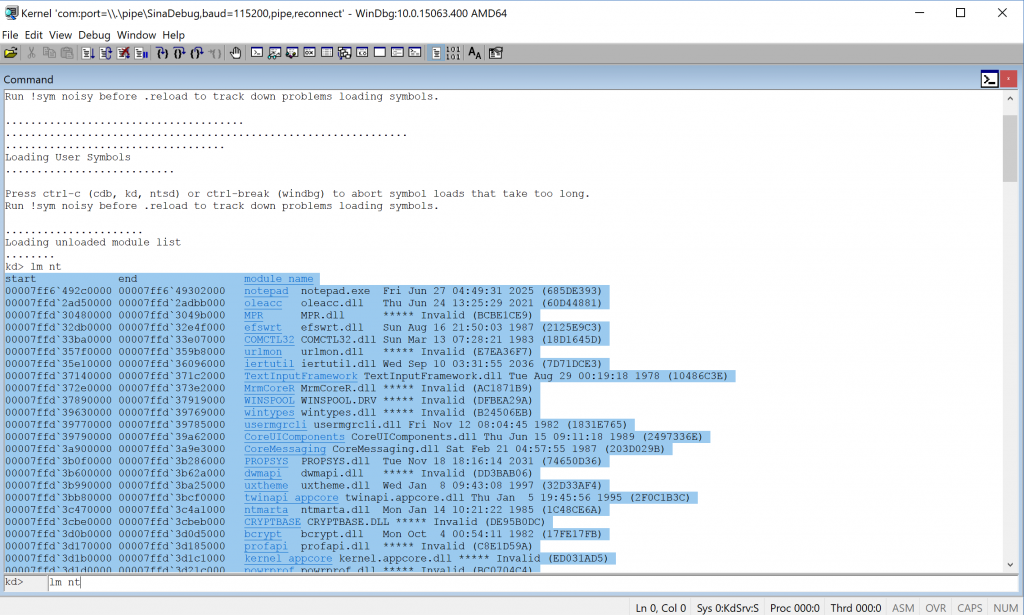
Remember you just loaded the symbols of Kernel-mode modules but now we need user-mode modules’ symbol to find the functions.
1
.reload
And wait till all current modules symbol become loaded.
After that you can see that user-mode modules loaded successfully and you get something like :
1
lm nt
So far so good ;)
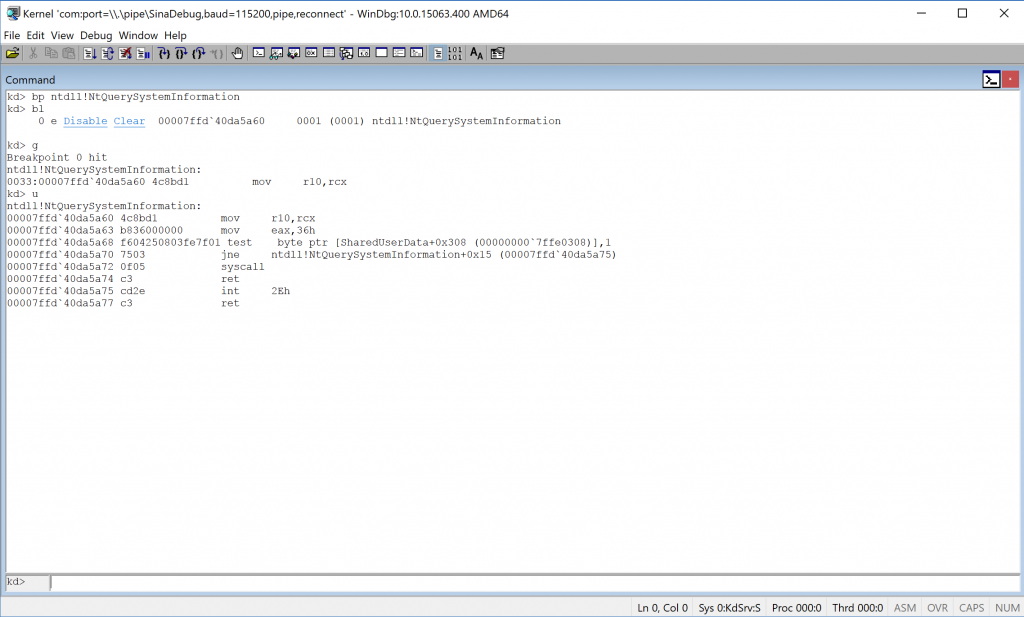
In this post, I’m gonna break on NtQuerySystemInformation which is a native function of ntdll but you can also break on everything you need, depend on address and symbol files(You can also break on your modules by loading their .pdb files.).
Let’s continue until the process calls the NtQuerySystemInformation …
The following picture shows how it performs :
Ok, everything is ready to step in or step out in windbg by the way you can’t debug like that :(
Because if you continue debugging, it is possible that kernel switches its context and your breakpoint hits for the second time and you will lose everything!
This problem can be solved by disabling the breakpoint so every time the kernel switches its context then windbg continues until you reach the last point where you were debugging that instruction.
I always use bl in order to view and disable my breakpoints.
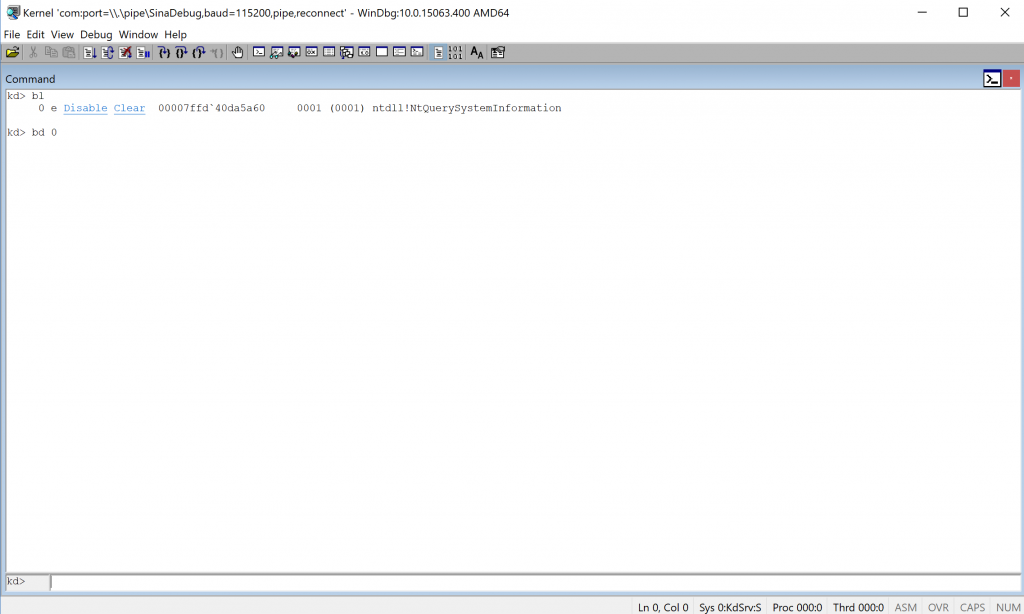
That is it!
Hope you guys have a sweet kernel exploring!
Comments powered by Disqus.